Definition
- Industry: Insurance
- Audience: Senior Managers, Line Managers, Producers, Claims Professionals
Use Case
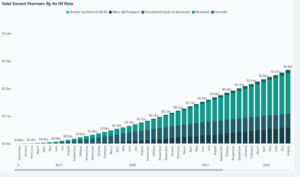
This report focuses on book growth metrics. It lists each key growth driver and displays both point in time and trend information.
- Renewal Rate: A combo chart of renewal amounts and renewal rates.
- Premium Change: This describes the aggregate impact of premium amount changes in each policy in both absolute and percentage terms.
- Carrier Rank: Premium and renewal rates are ranked by carrier. They can be sorted in ascending or descending order.
- Cost Center Rank: Cost centers are a synonym for programs. Program premium changes and renewal rates are ranked in the same way as carriers in the previous report.
- Submit Quote Bind: This page shows how much business is being closed out of everything the team looks at. This is a critical measure of productivity and efficiency. Underwriting is an expensive activity and targeting efforts on high potential business is a critical way of gaining efficiency.
How To Use This Report
For reports that display trends, filters on the left can be used to put the focus on different areas of the business, such as carrier, product, producer, etc.
Users can look across the top for indicators describing point-in-time performance.
Right-clicking on any column and most elements will open a menu with an option called ‘Drill through’. Upon selecting that, the user is taken to a secondary report listing all transactions that add up to the number displayed in the main report.
Other Power BI Insurance Report Samples
For more information about our insurance reporting and analytics services visit our Insurance Industry Page