Definition
- Industry: Insurance
- Audience: Senior Managers, Line Managers, Producers, Claims Professionals
Use Case
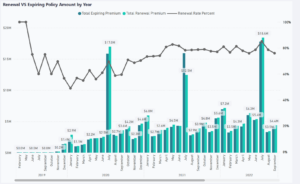
This report shows trends and key metrics on book performance. It combines both earned premium and incurred losses to produce a complete picture of book profitability.
- Gross Earned Premium Cumulative: by type of book, this report accumulates the accrued earned premium across the period.
- Gross Earned Premium Monthly: in contrast to the first report, this one shows the monthly change in earned premium.
- Incurred Cumulative: losses incurred and accumulating over time.
- Loss Ratio: cumulative earned premium combined with incurred losses. The loss ratio is shown as a line.
- Loss Triangle: Loss trends for different policy inception dates.
- Top Claims: A list of largest individual losses analyzed by Program and Insured.
How To Use This Report
For reports that display trends, filters on the left can be used to put the focus on different areas of the business, such as carrier, product, producer, etc.
Users can look across the top for indicators describing point-in-time performance.
Right-clicking on any column and most elements will open a menu with an option called ‘Drill through’. Upon selecting that, the user is taken to a secondary report listing all transactions that add up to the number displayed in the main report.
Other Power BI Insurance Report Samples
For more information about our insurance reporting and analytics services visit our Insurance Industry Page