Insurance Productivity
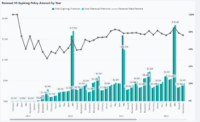
This report focuses on book growth metrics. It lists each key growth driver and displays both point in time and trend information.

This report focuses on book growth metrics. It lists each key growth driver and displays both point in time and trend information.
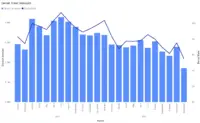
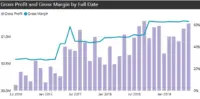
This report shows trends and key metrics on book performance. It combines both earned premium and incurred losses to produce a complete picture of book profitability.
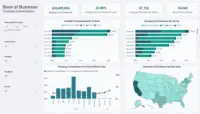
Definition Industry: Insurance Audience: Senior Managers, Line Managers, Producers, Claims Professionals Use Case This report gives insurance professionals visibility into multiple key revenue metrics.
Definition Industry: Healthcare Audience: RCM Managers Use Case This 4-page report was built with Power BI but any BI front-end tool can be used to
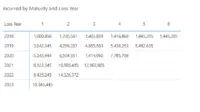
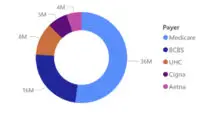
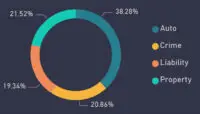
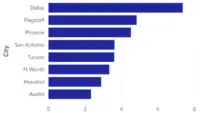
Definition Industry: Insurance Audience: Actuaries, Finance, Claims Managers Use case This Power BI report shows how claims and incurred loss data can be compiled into
Definition Industry: Healthcare Audience: Office of Finance, RCM, Upper Management Use Case This Power BI report breaks down charge lag key metrics: Lag days, amount
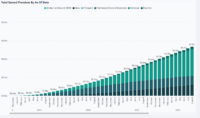
Definition Industry: Insurance Key Performance Indicator (KPI): Written Premium Audience: Executive, Underwriter, Producer, Actuaries. Broad user base. “Written premium is an accounting term in the
Definition Industry: Healthcare Audience: Providers, Business Managers, Practice Managers Use case This dashboard provides an example of how easily healthcare data can be consumed using

Definition Industry: Healthcare Audience: Revenue Cycle Managers, Business Managers, Financial Managers Use case This is an example of how billing and claim denials data can
Sales Dashboard and Reports (Sample Data) This is a live dashboard you can interact with and explore. It illustrates how data can be organized for