Charge lag is the primary charge capture challenge of many healthcare organizations. Lagging charges (aka charge lag, lag days, and billing delays) are the number of days between a patient visit (date of service) and the initial submission of a claim.
Lower charge lag results in faster claim submissions and faster collections. In extreme cases, charge lag can result in lost revenue due to timely filing deadlines. Charge lag can also trickle down to patient responsible balances collection rates. Balances not paid on insurance claims may shift to patient responsibility. Delays in filing a claim will delay the subsequent patient responsible invoice. Longer delays in patient invoicing often result in lower patient collections. Continue reading to learn more about this important KPI for revenue cycle management.
What to expect in this article
What Causes Charge Lag?
Consider the below graphic which represents a simplified workflow between a patient visit and a claim submission for a typical healthcare organization. The red highlighted areas often contribute to charge lag. Let’s look at several potential causes of delay.
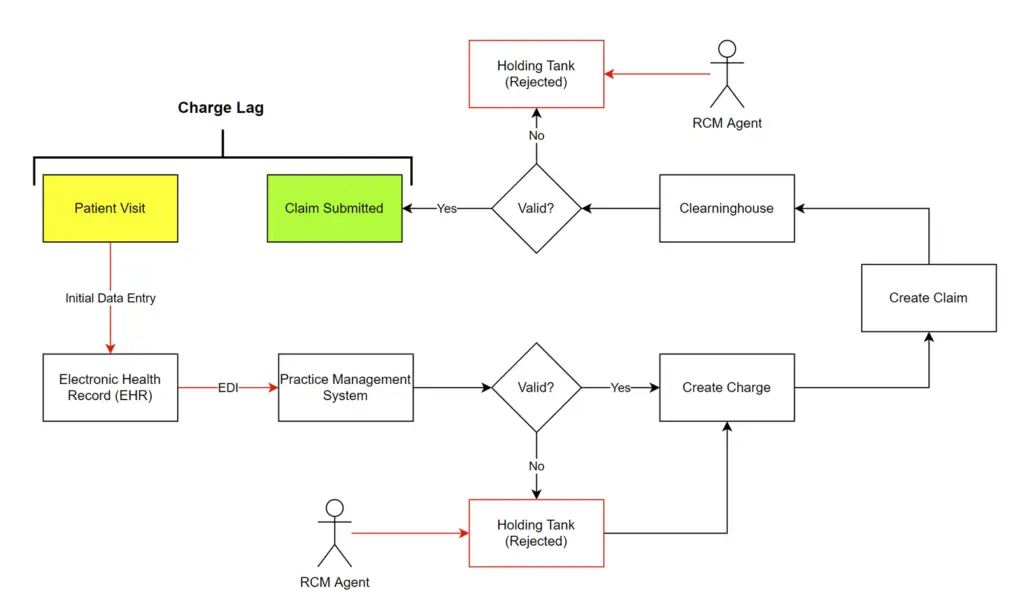
Note that we need to measure the time between the Patient Visit and the Claim Submission. In cases where the EHR and PM system are disparate, this requires data to be pulled from each system separately.
How does data get into the business system responsible for generating a claim (typically PM system)?
In some cases, the EHR (electronic health record) system and the PM (practice management) system are one in the same. This is ideal because visit details are immediately available to begin the claim generation process. However, in many cases the EHR and PM systems are not the same. In this case visit details need to be transferred to the PM system. This is the first potential cause of delay.
Are the patient visit details valid?
The PM system will need to ingest the patient visit details. Procedure codes, diagnosis codes, provider NPI, dates, patient details, etc. must all be valid for the PM system to successfully process the claim. If this data is invalid, then user (RCM agent) intervention is required. The RCM agent must manually assess the issue and find a resolution prior to the claim moving forward. This can cause significant delay depending on factors such as RCM workload, issue complexity, ability to retrieve missing clinical data, and more.
Did the clearinghouse accept the claim?
Like PM system claim rejections, the clearinghouse may also reject a claim. This too will require an RCM agent to investigate the cause for rejection, manually correct this issue, and resubmit the claim. Ideally the cause of clearinghouse rejections will be added to the PM system validation so that this issue can be captured upstream in the future.
How Can We Reduce Billing Delays?
Excessive lag days are nearly always a solvable problem. Most of the time there are a few key issues that account for much of the charge lag. Manage the remaining issues on a case-by-case basis. Consider the following recommended steps.
Step 1 - Measure Lag Days
It is very hard to manage something that you are not measuring. So, the first step is to really understand your situation. The measure we need is simply charge lag, but there are some key derivatives that are also important.
- Charge Lag: Number of days between a patient visit and initial claim submission
- Charge Lag Aged: Count of encounters binned by charge lag; 0-3, 4-5, 6-10, 11-15, 15-30, 31+ days
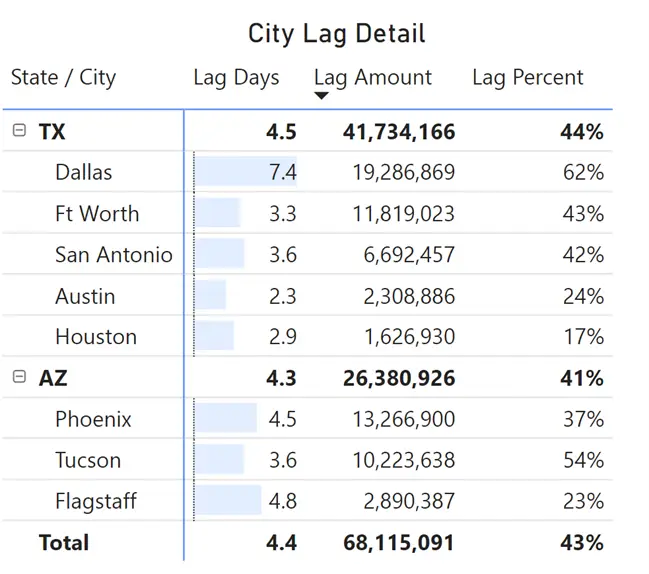
We also need to be able to slice these measures by several key attributes.
- Location (clinic)
- Date (DOS)
- CPT (procedure code)
- Provider (rendering provider)
- Payer (current responsible payer)
- Rejection Reason (PM or Clearinghouse reason for rejection)
Step 2 - Identify Causes of Charge Lag
Now that we can see what is going on, it is time to find the key causes for charge lag. We may find that there are specific clinics with very high charge lag. Or we may find that certain procedures (CPT) are associated with high charge lag. Using the above-described reporting capabilities, we need to find the combination of factors slowing the billing process.
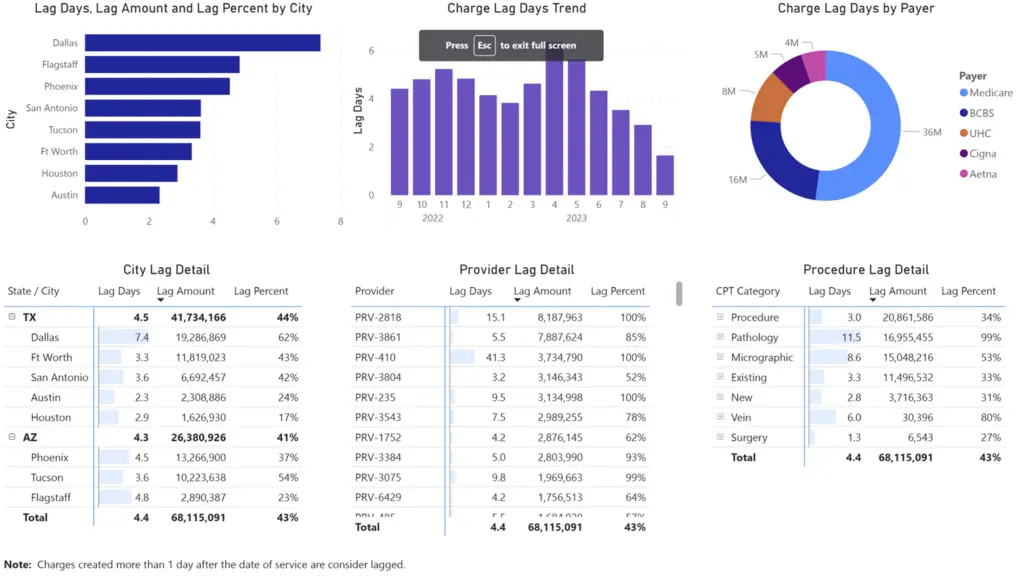
Using the above report, we can select the worst offenders. In this example, Dallas has the highest average lag days.
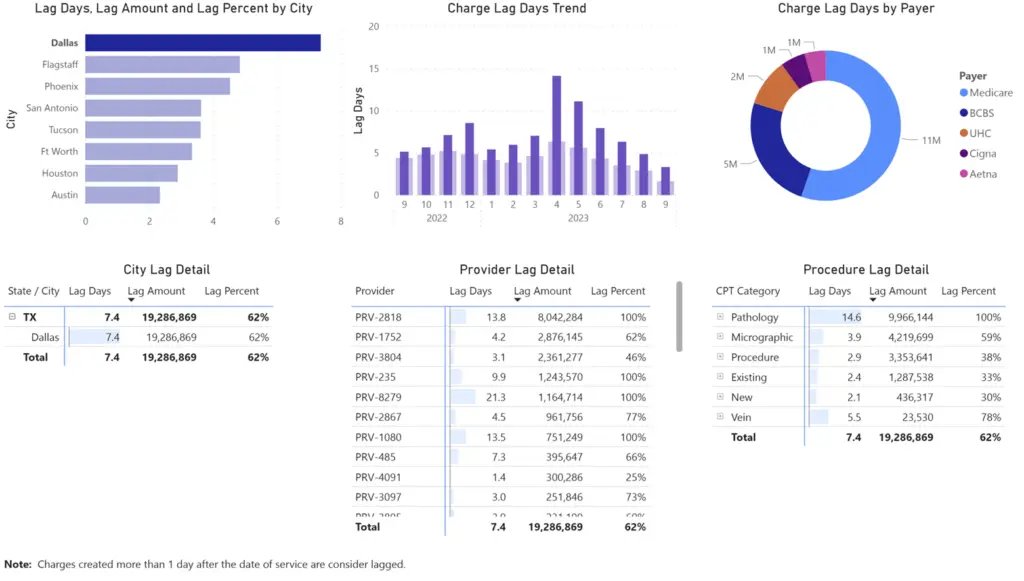
After selecting Dallas, all visuals are filtered to Dallas data only. Now we can continue to narrow our focus by selecting worst the Pathology.
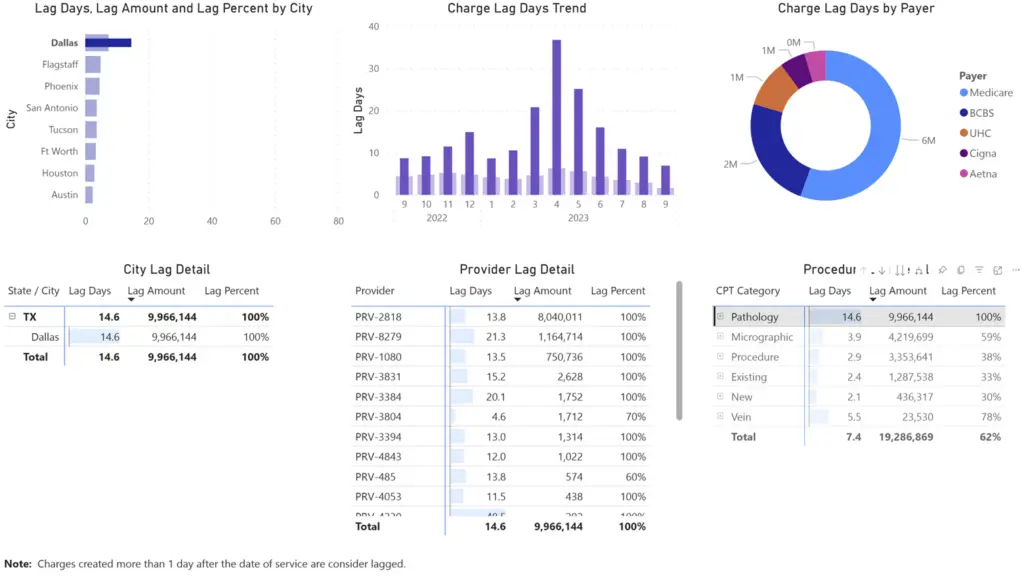
Continue down this path until we find the combination of factors (dimensions) that result in high charge lag. Pay particular attention to factors that you know impact charge lag in your business. For example, if your business process requires providers to submit charges manually, then focus on provider-based charge lag.
Step 3 – Adjust Practice Management Systems & Business Processes
It is time to act. This step requires someone familiar with the business processes and systems involved to formulate a plan to correct the top charge lag causes. Sometimes this can be very simple. For example, practice management systems will likely reject a charge if a national provider identifier (NPI) is not recorded. Try to solve this type of problem not only to fix today’s issues, but also to solve the issues that are likely to follow. Who is responsible for recording the NPI? How does this data get into the PM system? What monitoring is in place to alert responsible parties to missing NPIs? Solving the business process gap will prevent a lot of manual (and costly) work in the future.
Step 4 – Evaluate Impact
Reducing charge lag is not a one and done type of problem. The process needs to be managed on an ongoing basis. Reporting can help streamline this effort. Ultimately, charge lag impacts critical revenue cycle management KPIs such as Practice Charge Amount and should be accessible to leadership when diagnosing the cause of out-of-range KPI values.
Conclusion
In conclusion, charge lag is an important KPI for revenue cycle managers to monitor. Business processes and systems must be set up in a way that facilitates efficient claims submissions. Business Intelligence solutions can perform critical measurements, generate exceptions, identify key contributors, and reduce the amount of costly manual labor required to optimize this process.
Live Interactive Healthcare Charge Lag Report
Check out this Power BI live interactive report
Check out my prior podcast episode about Revenue Cycle Optimization.
Other resources you might find useful:
