
Upgrading SQL Server? No Problem.
LeapFrogBI projects can deploy to all SQL Server version from 2008 through 2012 (2014 coming soon). Even better, existing projects are forward and backward compatible.
LeapFrogBI projects can deploy to all SQL Server version from 2008 through 2012 (2014 coming soon). Even better, existing projects are forward and backward compatible.
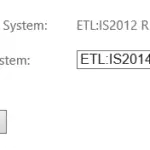
LeapFrogBI deploys to several target systems; SQL Sever 2008, SQL Server 2008R2, SQL Server 2012, and SQL Server 2014 (coming soon). Traditionally, migrating from one
Several LeapFrogBI processes use Excel to define configuration details such as FTP, HTTP, and MFS. In some versions of windows, the Excel application is set
Like many of you I have been waiting for SQL Server 2014 to be released to market for quite a while. Now that it has
Have you ever had the need to rollback your project to a point prior to the last load process? Well, it is easier than ever
Two new design patterns are now available. These design patterns, DP-4100 & DP-4101, generate all required components and related logic to track source system deletes
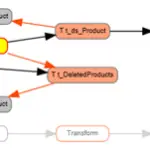
What to do when a data warehouse source system deletes a record? There are probably hundreds of answers to this question. If you want to
Anyone who has been involved with data warehousing knows that there are plenty of things that can go wrong. Mistakes can be made when researching
This initial load of a dimension can be a resource intensive process. The situation gets even tougher when the dimension’s natural key is not optimal;
LeapFrogBI’s dimension templates are designed to handle a number of use cases. Below is a list of currently available templates, along with a short description