McKinsey calls data and analytics the “future of insurance underwriting.” But according to a report from Capgemini, only 18% of insurers are capable of optimizing data to gain a competitive advantage.
Are you part of the 82% of insurance organizations missing the mark?
Don’t be. Data analytics promises a world of benefits for the insurance industry, from improved loss ratios to improved fraud detection, optimized underwriting, more strategic decision-making, and much more—but only if you understand the role of analytics in insurance.
In this blog post, we cover:
- How data analytics is changing the insurance industry
- The biggest benefits of insurance data analytics
- Top use cases of data analytics in insurance
- Examples of insurance reports
.
What is Insurance Analytics?
Insurance analytics describes the process of data collection, analysis, and reporting to identify trends, predict outcomes, and drive more informed decision-making across various insurance functions. Specifically, insurance analytics empowers your organization to assess and improve your performance on key metrics, such as loss ratios, premium growth, and policy counts.
How Data Analytics in Insurance Has Changed the Game
Insurance companies that have adopted the use of data analytics have seen diverse benefits, such as enhanced customer relationships and improved operational efficiency.
At LeapFrogBI, we believe that the power of data analytics begins with proper data preparation.
Data analytics can turn raw data into actionable insights that power better decision-making and more strategic planning—but only if you properly set the stage to do so. Pulled directly from transactional systems (such as policy administration systems or claims management platforms), raw data isn’t ready for reporting—at least not reports that will drive accurate, meaningful
analysis. Before you can jump to reports and analytics, raw data requires significant processing.
Many companies turn to reporting tools like Power BI and Tableau for help. While these tools are useful, they still can’t address all reporting challenges on their own. Instead, it takes seasoned data analytics experts to create a well-designed reporting architecture to ensure proper data preparation. Only then can insurance companies realize the full benefits of data analytics, like optimized risk assessments and more intelligent fraud detection.
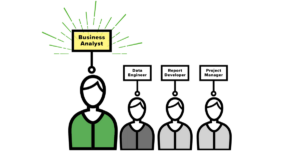
Ensuring proper data preparation is difficult, but it’s made easier if you work with a fractional data team who can provide comprehensive managed analytics services. At LeapFrogBI, our fractional data team gives you there-when-you-need-it, scalable access to a complete BI department, offering data modeling, ETL, and report authoring to deliver customized analytic solutions tailored to your insurance organization’s distinct requirements.
Why Leveraging Data Analytics is Vital within the Insurance Industry
Enabling insurance data analytics can be challenging—but the pay-off is worth it.
Here’s an overview of some of the benefits you can expect when your insurance organization implements data analytics:
Drive More Informed Decision-Making
Leveraging data analytics enables your organization to bring together key metrics from across different departments. Instead of consulting distributed, decentralized data sources, you can create one centralized repository of data insights to act as your organization’s single source of truth.
Importantly, all data is updated in real time and easily accessible via user-friendly dashboards and reports. This empowers employees at all levels of your organization to get the data they need fast to answer questions on the job and power fact-based, data-driven decisions.
Plus, because this repository is updated in real time, it ensures your data is always reliable and accurate, so you can make informed decisions with confidence.
Improve Loss Ratios
Reducing loss ratios is always a top priority for insurance organizations, as high loss ratios can indicate underwriting inefficiencies, inadequate pricing strategies, or rising claim costs—all of which ultimately cut into profitability.
But by using data analytics to assess claim trends, underwriting patterns, and policyholder behavior, you can identify the key factors driving losses—and then take action to course-correct and improve your loss ratio.
For example, suppose an analysis of claims data reveals that a specific policy type or geographic region has disproportionately high claims frequency. With this information, you can modify underwriting guidelines, refine risk models, or adjust pricing strategies to minimize exposure to high-risk policies, thereby improving your insurance organization’s loss ratios.
This is just one example of how you can use data analytics to identify areas for improvement within your insurance organization. Learn more about the benefits of insurance reporting on the podcast, More Than Reports.
Understand the Impact of Rate Changes
Rate changes can impact customer retention, underwriting profitability, and market competitiveness, risking financial instability and potential customer losses. But data analytics can help you better understand the impact of rate changes to help you make more informed pricing decisions.
Specifically, with data analytics, you can model how rate changes will affect key metrics, such as customer behavior and claims frequency, as well as your insurance organization’s overall profitability. This way, you can understand the potential outcomes of rate changes before implementation so you can mitigate risks and optimize pricing strategies for long-term growth.
Find Top Producers
Internally, you can use data analytics to identify your organization’s top-performing agents and brokers.
By tracking metrics like conversion rates, policy retention rates, and customer satisfaction scores, you can objectively identify the top producers who drive the most value for your organization. Many insurance leaders opt to implement structured incentive programs to reward top talent, boost motivation, and create a culture of high performance.
Beyond recognition, you can also bring top producers into professional development efforts. For example, by encouraging your top-performing agents to participate in training programs and mentorship initiatives, you can help replicate their successful strategies across teams to improve agent performance throughout your organization.
3 Top Uses of Data Analytics in Insurance
There are many ways to integrate data analytics into your insurance organization’s daily workflows to improve decision-making and profitability.
Here’s a look at the top three use cases of data analytics in insurance.
1. Risk Assessments and Underwriting
We know that data analytics helps insurance organizations make better, more strategic, data-driven decisions. This is particularly useful for risk assessment and underwriting, where errors in risk evaluation can lead to big financial consequences. Consider that in 2023 alone, State Farm reported an underwriting loss of $14.1 billion. With data analytics, you can get the real-time insights you need to power data-driven decision-making that helps avoid this kind of loss.
For example, instead of relying on historical trends to make underwriting decisions, you can use predictive modeling to evaluate a new applicant’s risk profile based on information like credit history, telematic data, and geographic risk factors. With this data-driven approach, you can more accurately identify high-risk policies and set premium rates accordingly to minimize losses down the line.
2. Claims Management and Fraud Detection
According to a survey from the National Insurance Crime Bureau, “one in five respondents admitted to at least considering committing insurance fraud.” Every year, insurance fraud costs the industry $300 billion, which the FBI says ultimately costs the average U.S. family between $400 and $700 per year in increased premiums. With data analytics, insurers can take steps to dramatically reduce these numbers by improving claims management and fraud detection.
First, you can use advanced analytics to detect anomalies in claim submissions; any deviations from established patterns can be a red flag for potential fraudulent activity. For example, if a claimant submits a high number of high-value claims in a short period of time, this may be a sign to initiate further investigation.
You can also use real-time data analytics to assess claims as they’re submitted to flag suspicious files, e.g., inflated repair costs or duplicate claims. This way, you can take immediate action to investigate these claims—and minimize financial losses by preventing payments before they get to fraudsters.
By integrating data analytics into claims management and fraud detection processes, you can reduce unnecessary payouts and mitigate losses.
3. Regulatory Reporting
Insurance companies face extensive regulatory requirements and severe consequences for non-compliance. According to the Federal Insurance Office’s (FIO) Annual Report on the Insurance Industry, the FIO has the authority to collect insurer’s data to ensure regulatory compliance. But by using data analytics to support reporting efforts, insurers can not only help mitigate non-compliance risks but streamline reporting efforts, relieve teams of administrative burdens, and improve overall compliance efficiency.
First, you can use data analytics to track regulatory changes, ensure data accuracy, and generate real-time compliance reports, reducing the potential for errors that could lead to costly non-compliance penalties.
Plus, integrating data analytics into your compliance framework can streamline regulatory reporting operations with automated data collection, validation, and submission processes, smoothing administrative operations and reducing your team’s manual workload.
3 Examples of Insurance Reports with Interactive Dashboards
Reports and dashboards offer a clear view of your data, giving you a window to analyze trends, spot patterns, and glean valuable insights that empower you to make confident, strategic decisions for your organization.
Here are 3 key examples of reports that support insurance analytics:
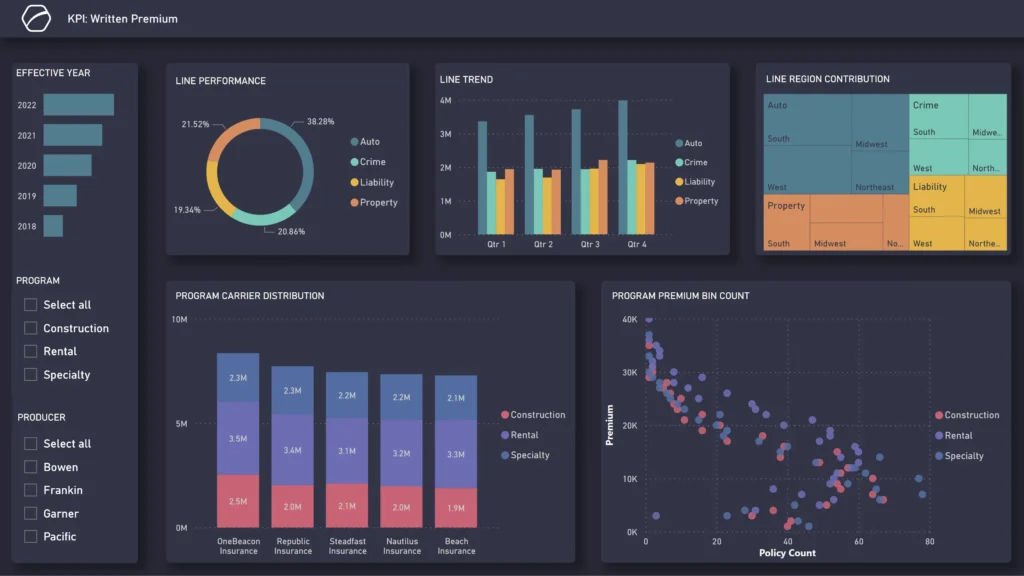
1. Insurance KPIs: Written Premium Report
A written premium report quantifies the total premiums on policies issued by your insurance company over a specific period, regardless of whether or not the premiums have already been earned. This is an essential report to assess the size, growth, and stability of your book of business and provide a comprehensive view of your organization’s overall performance.
With a written premium report, you can track and analyze key performance indicators (KPIs) to measure your actual performance against your strategic goals. For example, by monitoring premium growth, you can see if you’re on track to meet your financial goals—and identify areas where you may need to course-correct. Additionally, this report helps you pinpoint top-performing agents, profitable segments, and key market influencers driving premium growth.
Want to see an example? Check out this fully interactive dashboard of a written premium report.
Bottom line: A written premium report allows you to monitor trends over time so you can identify patterns, assess your organization’s position in the market, and make informed, fact-based decisions to enhance business stability and competitiveness.
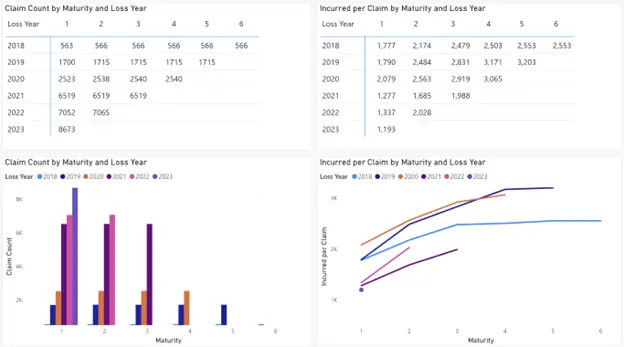
2. Loss Development Triangle Report
A loss development triangle report is an important analytic tool that estimates how losses develop over time, helping insurers make more strategic, informed decisions about rate adequacy and reserve allocations.
Specifically, this report organizes claims data to show the progression of claims over successive periods. This way, you can get a clear view of the maturation of losses to better understand loss development patterns and determine whether current premium rates are sufficient to cover estimated claims.
Additionally, a loss development triangle report can help you:
- Evaluate loss emergence and settlement trends so you can set appropriate reserves and refine pricing strategies as needed;
- Compare your performance against industry benchmarks so you can identify areas for improvement;
- Proactively adjust rates and reserves based on real-time insights so you can reduce the risks of unexpected loss and set the stage for long-term financial stability.
Want to see an example? Check out this fully interactive dashboard of a loss development triangle report.
Bottom line: A loss development triangle report empowers you with real-time insights to more strategically manage losses, set accurate pricing, and prepare reserves for ongoing financial stability.
3. Book of Business Report
A book of business report gives you insights into key revenue metrics, such as premium growth, policy growth, and producer performance. This report is essential for getting a comprehensive understanding of your organization’s portfolio so you can make fact-based decisions about resource allocation, market expansion goals, and potential product development.
For example, by using data analytics to look at premium growth over time, you can identify which product lines are generating the most profit—and then allocate resources accordingly. Meanwhile, you can monitor policy growth to gain insights into the effectiveness of different marketing strategies and use that information to sculpt future campaigns. Finally, evaluating producer performance allows you to recognize and reward your organization’s top agents and brokers whom you can encourage to lead training initiatives to help strengthen your entire team’s skillsets.
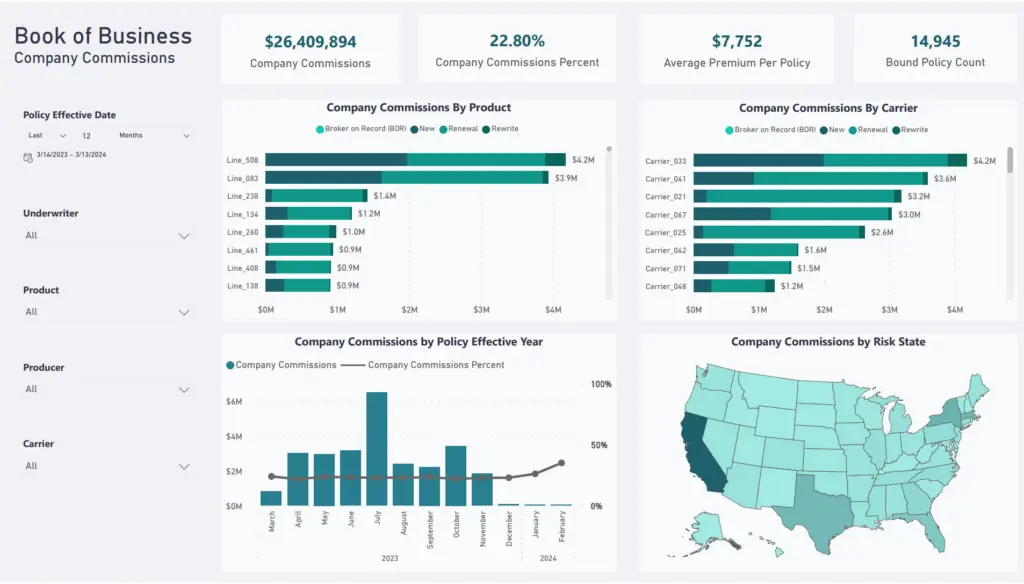
Want to see an example? Check out this fully interactive dashboard of a book of business report.
Bottom line: A book of business report gives you a holistic, 360-degree look at your organization’s portfolio and operations, empowering you with real-time, up-to-date data to make decisions that prioritize profitability and sustainable growth.
Ready to Unlock Insurance Data Insights? LeapFrogBI Can Help
Insurance data analytics can help your organization improve loss ratios, understand the impact of rate changes, find top producers, and much more. But without deep data expertise, enabling insurance reporting and data analytics can be a thorny process.
At LeapFrogBI, we understand the unique challenges insurance organizations face across sales production, profitability, and operational efficiency—and for every challenge, we know that data is the answer.
With the right data at your fingertips, you can make informed, strategic decisions that enhance underwriting accuracy, optimize pricing, reduce fraud, and position your organization for long-term financial stability.
Learn more about how we help your team implement insurance analytics for smarter decision-making, streamlined reporting, and a data-driven, competitive edge.
FAQs
What types of data are used in insurance analytics?
Insurance analytics combines structured and unstructured data, such as claims history, premium growth, customer retention rates, underwriting patterns, etc. By analyzing these datasets, insurers can confidently make evidence-based decisions to increase underwriting efficiency, streamline regulatory reporting, right-size pricing strategies, mitigate fraud, and much more.
How can insurance companies get started with implementing insurance analytics?
Insurance companies can get started with data analytics by identifying key business objectives and fostering a data-driven culture in house. Ultimately, the best way to implement insurance analytics is to work with an expert data partner who can build customized reporting dashboards that match the needs of your unique organization.