Few businesses feature as many moving parts as banking. A variety of existing products, each with specific rules, and a constant influx of new products and technological innovation make the challenges of running a bank unique. To compound the problem, the recent and abrupt jump in interest rates completely reset investing parameters for American savers. Those conditions provide the setting for trying times at credit unions and regional banks.
After years of rock bottom interest rates, investors became accustomed to not expecting any meaningful returns from money parked in checking, money market, or even CD accounts. As of this writing, Fed Fund rates have sat at above 5% for about 6 months and the shift in investors’ portfolios towards interest-based returns remains strong.
This sudden and dramatic change in conditions set the stage for the biggest change in investor behavior in recent history. CDs and money market accounts are back in the game and your friend is now telling you how much they’re making on that highly liquid, online money market account. For credit unions and small regional banks, that means that deposit bases have become much more volatile, putting pressure on managers to react quickly, or risk losing depositors.
The Moving Parts

The rates banks use to attract investors directly impact their funding costs. More competition for deposits and funds translates into more expensive money and, depending on the general appetite for credit, potentially lower spreads. Regardless of the situation on the lending side, this will certainly push money away from lower cost checking accounts and into higher cost CD accounts, an effect also known as cannibalization.
But any attempt at protecting your margins by keeping your rates lower will leave you less money to lend, as clients will promptly move their money to the competition if your rates fall behind.

Whichever way you look at it, profits are being reduced.
Drawing Your Own Curve
Isolating and understanding the forces in play is an important part of the effort, but it won’t tell us what are the exact points at which any organization, given its own depositors with their specific behaviors, should set its rates for optimal outcomes.
For that, we need actual data. The starting point should be a record of all asset reallocation events by individual account holders going as far back in history as possible. In particular, we will want to look at what happened every time a CD expired as well as rates at which new CDs were bought.
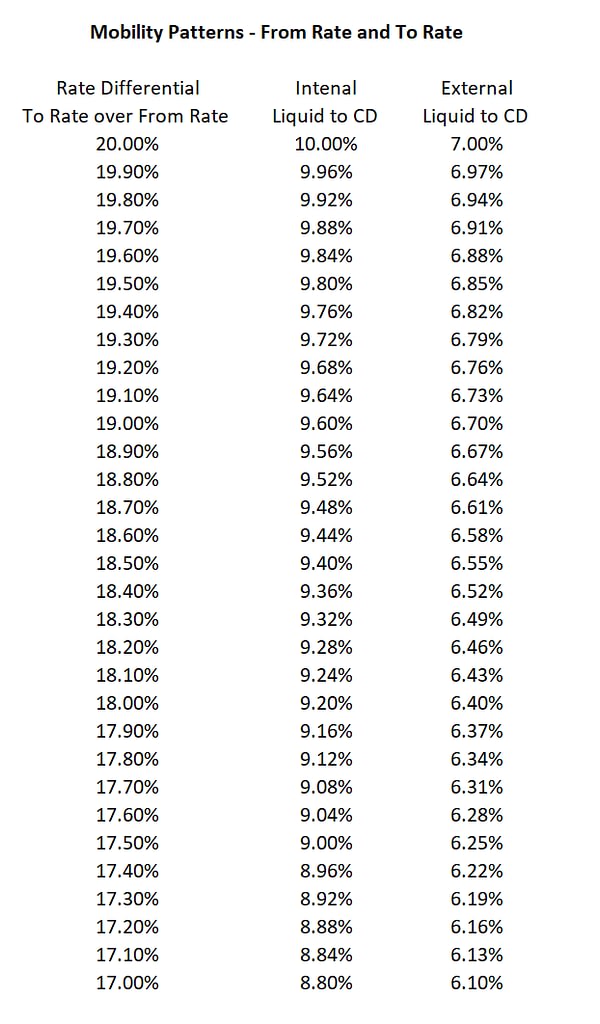
We will also want to know what the rate differential—the difference between the rates we offered, and the rates other comparable institutions offered—at the time when new CDs were sold to both existing and new depositors.
Our dataset must be split into two types of transactions: external money, new clients coming into our CDs, and internal (cannibalization), existing clients moving their money from low-cost accounts into CDs.
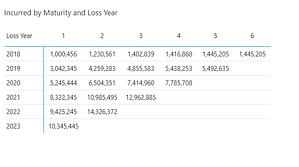
The table on the right was built with mock data but shows in realistic terms that internal movements of balances are more pronounced than any increases in the deposit base from new money. That means that the effects of cannibalization can be powerful and need to be carefully analyzed before rates are set.
This is more easily seen in the set of curves displayed below, where for different lending scenarios and offered rates, we can measure the net impact of cannibalization on spreads.
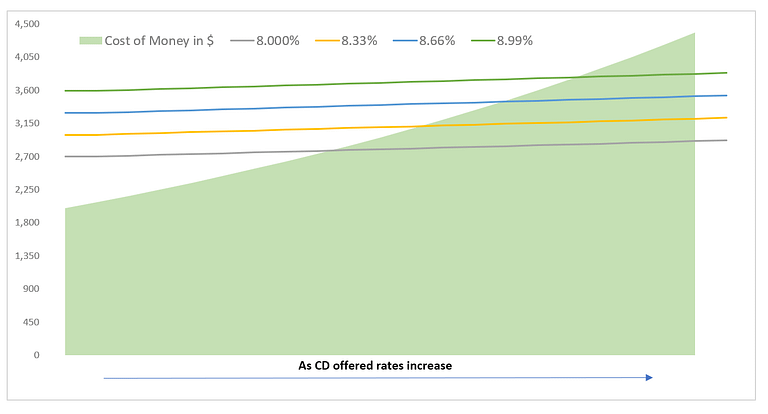
The graph above shows how cannibalization can potentially eliminate lending margins. We see that the rate of cannibalization is high enough to, at a different point for different aggregate lending rates, make lending unprofitable. Each institution’s client base will behave differently, but when exposed to increasing CD rates, will move funds, thereby putting pressure on lending margins. Also note that for each aggregate lending rate, there is a gain in revenue given that more funds are available for lending. However, we have observed that the increase in money available for lending is more than offset by the increase in cost produced by margin cannibalization.
As we said before, to produce a real version of the graph above, all that’s required is the record of both product sales and market rates for the relevant financial products. If the data exists but sits in disparate systems, the best move is to ensure that going forward a central data repository of product transactions and market information is in place. Any reporting system could use that data to quickly plot the necessary curves.